Rounding Tops and Bottoms
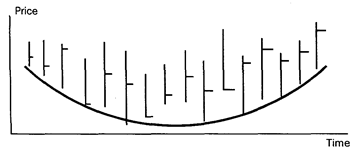
| A less frequent, but no less useful technical formation is the rounding bottom and rounding top. They are sometimes referred to as saucers and inverted saucers, respectively. As the name implies, a rounding bottom occurs when prices gradually shift from a downtrend to an uptrend to form a short of shallow "U" shape on the charts. To validate this formation, it is important that the volume also form a saucer formation: that is, volume should gradually decline as the downtrend ends, then slowly increase as prices begin to rise again. In a bottom formation, this type of price action represents accumulation — the "smart money" slowly adding to long positions. At tops, this formation represents distribution, or the "smart money" getting out of long positions and adding to short ones. A common variation of saucers is for prices to rise sharply and suddenly on strong volume near the mid-point of the formation. This activity only lasts a few sessions, after which prices fall back within the rounding pattern. It is difficult to determine exactly when the pattern is complete, but a good indication occurs when volume begins to increase sharply or prices break an important area. | 0: 'saucer ae 'shallow ae to validate smart money | — блюдцо, соусник — мелкий — узаконить, сделать действительной — вложение денег без риска, используя секретную информацию |
Comprehension Questions
1. How many prices does the dealer need to know to read the market?
2. What affects the open price?
3. What does the high near the end of the trading session show?
4. Why is the close called sentiment?
5. What do price patterns indicate?
6. Which is the most popular reversal patterns?
7. What role does volume play with Head and Shoulders patterns?
8. Compare Double Top and Rounding Top patterns.
Exercises
Ex. 1. Put questions to the underlined words.
Ex. 2. Compare the reversal patterns and state their difference.
Ex. 3. Translate the dialogue from English into Russian in writing and from Russian into English orally.
Dialogue:
Client: What are the prerequisites of reversal patterns?
Broker: A prerequisite for any reversal pattern is the presence of a trend. A break in the trend line usually
accompanies a reversal pattern. The lai-ger the pattern, the greater the significance. CI: When does a retest in the Right Shoudler take place? Br: A retest is always a retest of the climax whether it be a top or a bottom. CI: What are the conditions for a retest of a climax?
Br: In a trending market there must be a rally. Market has a sharp turn down. New buyers start buying. CI: And the new buyers are not enthusiastic. Br: No, they are not. Declining volume and trading range confirm that. CI: When is the retest complete?
Br: The retest is complete if the buyers falter within the 50% region of the climax retest and price turns sharply down. A retest does not require the trader to wait for a break of the previous low pivot point.
TRANSLATION PRACTICE
New Concepts in Support and Resistance
Fig. 1

| There is an understandable tendency to look to see kev horizontal support and resistance levels tested when they are reapproached. Many traders tend to set profit targets referenced to such levels, and stops also tend to be positioned relative to breaches of these levels. This is all verv well but disappointment often results as the key support and resistance levels in a structure aren't necessarily the isolated highs and lows. Thus very often the market will reverse just short of these levels, much to the fury of many traders who'd been counting the pennies before they were securely in the till! Consider the stylised bar chart in figure 1, areas (A) and (B) represent a two period reversal stmcture that is commonly seen in the markets. Taking the highlighted (A) area first, the bulls would have been well contented at the close of the period (close "C"). However, they were due for a shock, as whilst the market did push higher to begin with in the next period (sucking more weakly committed bulls in), by the close (close "D") there were a lot of unhappy and damaged traders around. The high of the first period "b" constitutes a much more potent resistance level when retested, than the actual isolated high of the structure marked "a". This is not to say that "a" won't be attacked, but time and again you'll find it's "b" where the real battle is fought, and where the subsequent reversal or | Vocabulary to set targets — ставить цели ja fury — бешенство till — касса л to suck in — всасывать ou 'potent - сильный |
| consolidation will be initiated. In the practical sense one could say "b" is more significant than "a" due to a greater degree of market confidence at "b", and it is almost certainly associated with higher volume. There is however another way of looking at it, which I call the "Concept of Maximum Bearishness/Bullishness". Maximum Bearishness/Bullishness If in the first highlighted period of (A) the bulls had been totally in control, with the bears utterly routed, then the close of the period would have been at "b", the period high. One can look at this pullback from the high — the difference between "b" and "с" — as representing the ability of the bears to fight back. Similarly in the second oeriod of (A) the orice difference between "d" and "e" represents the ability of the bulls to fight back after being mauled. The way to evaluate which is the period of maximum bullish strength in any structure (which is where the bulls had maximum control) is to sweep back these differences (the pullback from the high) through the respective closes and compare the levels obtained. This is the concept of SWEEP and it is the period with the highest sweep level that constitutes maximum bullishness. The high of this maximum bullish period is a key resistance. I think it can be easily seen that reflecting "b"—"c" back through "c" gives a much higher level than reflecting "a"—"d" back through "d". Thus it's the first period of (A) and its high "b" that qualifies as the maximum bull point not point "a", despite it being higher. Note the maximum bull period may indeed be the one that includes the actual isolated high (area (D) is such an example). Resistance Level Strength Price action as depicted in (A), being a two period bull reversal structure, needs to be viewed in light of the above if, or when, the market returns to the same level. There are a couple of tests that can be applied to make a judgement on how potent the resistance level "b" is likely to prove: 1. Reflect the "sweep" movement of the price curve points "b"-"c" down through "c" and "d"-"t" up through "d". Do the two levels cross or are they able to "hold hands" as I term it? If they do not, it's a measure of how many people have been caught and how badly they've been caught. It is the pain and distress that materialises from a reversal level that directly and strongly influences how potent it will prove at a later time. If the reversal was violent, closing on or near the low of the period and thereby giving the majority in a bad position little or no time to get out, then "b" will return to "haunt" the market if the level is re—attained — pain is remembered even if only subconciosly! 2. Look at the price action following the reversal period, did it make a fair job of re-tracing before going down again, or did the market just plummet? If it's the former then "b" won't be nearly so key a level than if we get a nose dive. Again it comes back to giving traders an opportunity to get out when wrong without a serious loss. Remember a violent one-way market means somebody somewhere is in distress! | au |
| to rout — разгромить | |
| о: | |
| to maul — калечить, бить | |
| to hold hands — занимать выжидательную | |
| политику | |
| e distress — горе | |
| pain — боль | |
| О'. | |
| 'to haunt - преследовать | |
| л | |
| to 'plummet — резко упасть | |
Exercises
Ex. 1. Put questions to the underlined words.
Ex. 2. Find verbal constructions and state their syntactical function in the sentence.
Ex. 3. Select sentences which present difficulties for translation and make a syntactical analysis of them.
Ex. 4. Draw up a plan of the article.
Ex. 5. Enact an imaginary dialogue between the author and a dealer on support and resistance.

TECHNICAL ANALYSIS PATTERNS (CONTINUED)
| Continuation Patterns (TRIANGLES, PENNANTS, FLAGS, WEDGES,RECTANGLES) | continuation patterns - фигуры продолжения - Vocabulary |

| Э: | ||
| Continuation patterns confirm the continuation of an existing trend. They indicate that a sideway price movement is only a pause in the prevailing conditions. | 'pause e | - пауза, отдых |
| Triangles | ascending | - восходящий |


The ascending and descending triangles are price patterns that occur on bar charts and are similar in many respects to the more familiar symmetrical triangle. An ascending triangle is formed by a high. a low, a second high approximately equal to the first high, and a second low which is higher than the first low. For a descending triangle the situation is reversed. This pattern forecasts future price movement because prices are expected to break in the direction of the two equal price levels (to the high side on ascending triangles, and to the low side on descending triangles). In order for the pattern to be valid, two important conditions must be met:
1. Volume and open interest should decline as the triangle forms.
2. The breakout should occur between 1/2 to 3/4 of the distance from the start of the pattern to the apex.
When a breakout occurs, prices should continue in the same direction by an amount equal to the distance from the highest high in the triangle to the lowest low. The symmetrical triangle is seen when highs become lower and lower, and lows become higher and higher, with the resistance and support lines converging. This must be done in nearly a horizontal trend to avoid forming a wedge. Keep in mind that triangles are quite often continuation patterns, see Flags.
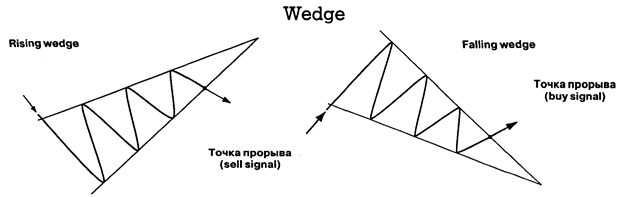
| A wedge pattern on bar charts is similar in certain respects to a symmetrical triangle formation (in fact triangles are some times referred to as wedges). However, wedees have distinct features from triangles: A rising wedge is characterized by a high, a low, a higher high and a higher low. This will give the appearance of an uptrend, but in a wedge the line connecting the highs and the line connecting the lows converge, whereas in a channel they will remain more or less parallel. In a triangle, either the highs or the lows are roughly equal, or else the convergence takes place with no trend implications, as in a symmetrical triangle. It is rising, or falling, nature of the wedge that separates it from the triangle formation. Wedges form most often as a counter-trend consolidation area. This means that during a strong downtrend, a rising wedge will sometimes form as a corrective pattern before the down trend resumes. Thus, a rising wedge has bearish implications, and a falling wedge has bullish implications. After the wedge forms, a breakout is confirmed when prices break the corresponding trendline the lower one in a rising wedge and the upper line in a falling wedge. After the breakout, prices should travel at least as far as the starting point of the formation. Rectangle | |
| Э: | |
| converge | — сходятся |
| ei | |
| implication | — то, что подразумевается |
| e | |
| rectangle | — прямоугольник |
| о | |
| to resolve | — разрешаться, решаться, |
| формироваться | |
| u: | |
| clue | — указание, наметка |
| ae | |
| to validate | -узаконить |
A common consolidation pattern that occurs on price charts is the rectangle. This technical formation usually occurs at the end of a strong market move, either an uptrend or downtrend, and typically represents a pause in the action. A rectangle is also known as a trading range or a consolidation and is easy to observe because price movements are clearly confined by two parallel lines. A rectangle normally is resolved as a continuation pattern, see Flags. This means that prices should continue in the direction they were moving before the consolidation began. Another clue to the direction of the breakout is the volume pattern within the rectangle. If volume is stronger during the rallies than on the declines, the upside breakout is more probable. The measuring objective after a breakout is determined by the height of the trading range. This distance is added to the level of the breakout point to reach a minimum objective. Similar to a triangle pattern, strong volume is necessary on an upside move to validate the breakout. It is not necessary for a downside breakout.

| One of the most reliable of all technical formations is the flag or pennant pattern. These patterns are very similar. Both are formed after a sharp, straight-line move that occurs on heavy volume (either up or down). After the move. a flag is formed by a short, choppv consolidation period. This consolidation is bounded by two parallel lines (rectangle). A pennant is formed after a strong move during a short consolidation period that resembles a small triangle or wedge. Flags and pennats are almost always continuation patterns, and are confirmed when volume declines during the consolidation, then prices break the respective consolidation trendlines on strong volume (i.e., the upper boundary line after an up move, and the lower boundary line after a down move). After the breakout, prices should continue moving by an amount equal to the move that preceded the brief consolidation. In this respect, flags and pennants are said to "fly at half mast". The beginning of the move is usually the point where prices broke out of another chart pattern, or breached important trendline support or resistance. Pennants A pennant is a fairly common formation, sharing most of its characteristics with flags. Both are formed in dynamic markets. with a "flagpole" formed by an impulsive almost straight line move. A brief period of consolidation results to form the pennants "mast", which is shaped like a small symmetrical triangle. Thereafter, prices move in the direction of the initial impulsive move and for a similar distance, i.e. the mast evolves halfway through the move. Thus to measure the distance of the total move, the length of the flagpole up to the mast is measured and projected from the breakout point of the pennant. | |
| э | |
| 'choppy — часто меняющийся | |
| i: | |
| precede — предшествовать | |
| to fly at half | |
| mast — приспущенный флаг | |
| э | |
| evolve — развертываться, | |
| эволюционировать | |
| е | |
| project — проектировать | |
| Gaps Consecutive transactions can be dealt at significantly different prices. Price gaps that occur within a day's trading do not show up on a bar graph because the graph will show the range for the day. However, if the closing high on one day is below the low of the next day (or one day's low is above the next day's high), a gap actually shows on the bar graph. There are four basic kinds of gap. One, the runaway gap. reflects a continuation of the move. A runaway gan appears after a significant move has already occured. In indicates that the move has received a second wind and is ready to go higher with relative ease. The runaway gap frequently occurs approximately halfway along a major move. Common Gap | e consecutive л runaway as 'gap a second wind | последующий — убегание — скачок усиление |

| Two of the other three kinds of gap, the common gap and the breakaway gap, are important in terms of market reversals. The common gap materializes on one day but subsequently gets filled in. It often is nothing more than the result of thin markets. It is viewed by most practitioners as a false signal, although it can be an indication that the market is leaning to break out in the direction of the gap. The breakaway gap frequently occurs at the end of a con Solidation phase, at the end of a key price pattern, or after a major support, or resistance line has been broken. It usually represents the beginning of a fairlv major move. A breakaway gap is often sharp because those with wrong positions not only will get out of the bad position they are in, but will also establish positions in line with the market move. A breakaway gap may get partially filled in, but mot totally. The fourth kind of gap. an exhaustion gap, occurs near the end of the market move. The market tries to jump forward, but there is little support for the move, and the market quickly retraces. When prices come back through the gap, it is a fairly reliable barometer that the move is over. The exhaustion gap often correlates to the period when small players enter the market. When that happens, in is another signal to be a contrarian and to expect the market to reverse. | ||
| in line with | — в соответствии с | |
| ei | ||
| retrace | — возвращаться по пройденному | |
| пути | ||
| Э: | ||
| correlate | — соответствовать | |
| еэ | ||
| contrarian | — идущий от противного | |
| to fill | - наполнять | |
Islands
Islands are an even more extreme example of a change in market sentiment giving a sharp reversal. An island is formed by at least two gaps. In an uptrend reversal, the first gap is a "break away" as the market opens higher than the previous time periods high, and maintains that gap. The gap is never "filled" in that at least one entire time period is traded above the gap. The reversal occurs when prices fall sharply in a subsequent period, whether it be the next period or many later. The drop has to gap through, leaving an island of price activity clearly defined by at east two gaps, one up, one down. The reverse is tme in a turn of a bear market. Futures markets sometimes have gaps. while 24-hour foreign exchange markets tend to see them less frequently. When seen though, they can be powerful indications of a trend change.
Comprehension Questions
1. What do continuation patterns show?
2. How are ascending and descending triangles for med?
3. How do wedges differ from triangles?
4. When do wedges form a counter trend consolidation area?
5. Why is a rectangle called a trading range?
6. Why is the flag, or pennant pattern one of the most reliable of all technical formations?
7. When does a gap usually show on the bar graph?
8. What kinds of gap do you know?
Exercises
Ex. 1. Put questions to the underlined words and let your partner answer them.
Ex. 2. Describe the market situation using the gaps chart.
Ex. 3. Read and translate the text.
Ex. 4. Select sentences which are difficult to translate and make a syntactical analysis of them.
TRANSLATION PRACTICE
New Concepts in Support and Resistance
In the spot Yen chart (figure 2) the reversal at a.) was violent, once the maximum bullish point was lost it was not seen again. This level later serves to top out a strong rally leaving high order isolated high (an isolated high that has several lower isolated highs in each side of it). Level b.) is nothing like so decisive. Look at the pullback from the high during the second period of the reversal. Level b.) acts as support and rebuffs a subsequent
| downward thrust, but it is not really potent — accordingly it gives up without much of a fight a little later. c.) is similarly weak, and on eventual attack it gives way easily. d.) and e.), however, constitute strong support (d.) and resistance (e.) when retested, as here the potential for getting un- | Vocabulary ou 'potent — мощный |

| pleasantly caught was high. Finally we have the classic case of f.) where the reversal sweeps "don't hold hands" and price rallies rapidly and decisively. Accordingly the max bear point level f.) serves to halt a subsequent strong downthrust. The hourly Spot Stg chart (figure 2) shows four reversal Levels that have one property in common, namely they each represent the period of maximum bullishness [b.) and c.)] and bearishness [a.) and d.)] of their structures. (Note the period of maximum bullishness/bearishness should always be looked for in any reversal or consolidation structure.) Whilst in the great majority of cases it is constituted by an isolated high or a two period reversal of the type discussed (high and low of the first period depending on direction of reversal), this is not always the case. Sometimes this point can be "cunninglv" hidden amongst the oscillating price action (eg. "c" in the Stg Hourly chart) yet it will still represent a key level if the area containing it is re-challenged. How long do these horizontal support/resistance levels maintain their influence? When price action reaches key levels it is more common to find price stalling than rushing straight through like a runaway train. This stall mav precipitate a reversal or a consolidation. where the market gathers itself for a decisive push through the price obstacle(s) that has temporarily balked it. When price breaches support/resistance it weakens it, even if by the close we have returned back through the level. | To precipitate - ускорять |
| to hold one's | |
| hand — воздерживаться от действий, занимать выжидательную позицию | |
| to stall — задерживать | |
| ei | |
| failure — точка неудачи | |
| correlation — оказаться в соотношении |