An Example of a Table Description
Underground railway systems

The given table shows data on underground railway system of six cities namely London, Paris, Tokyo, Washington DC, Kyoto and Los Angeles and compares these rail stations opening date, route(трасса)[ruːt] and passengers number.
As is observed from the given data(каквидноизданных), London railway system was established (былаоснована) in 1863, which makes it the oldest underground railway system and it has more than 390 km of route which is also the largest route among[ə'mʌŋ] (среди) these six cities. Each year more than 700 million passengers use these underground railway stations of London. Paris underground railway system was started in 1900 and it has almost (почти) 200 km route[ruːt] with more than 1190 millions of passengers. Tokyo underground railway system has the largest passengers (more than 1900 millions) and it was established in 1927 that has 155 km of route. Kyoto underground railway system was opened in 1981 and it has the smallest route of 11 km and least (меньшевсех) passengers (45 millions) use this system among the mentioned (средиупомянутых) six cities. Washington Dc and Los Angeles underground railway system were established in 1976 and 2001 with comparatively (сравнительно) smaller routes and few passengers. The Los Angeles underground railways system is the latest railway system in terms of the dateit was opened (поотношениюковременипосторения) and has second smallest number of route (28 km) and passengers (50 millions).
In conclusion (взаключении), the oldest underground railway system is in London and Tokyo has the largest number of passengers of their underground railway system.
An Example of a Table Description

This report summarises information on the total number of students in the United Kingdom who gained (получили) qualifications for English Language Teachers in two academic years, 2007/8 and 2008/9, with specific focus on the number of male qualifiers.
In both years, the total numbers of students remained the same (осталсятемже), but there was a great difference between the numbers of male and female students who qualified. In 2007/8, out of a total of 32,930 students, only 24.7% were male. The percentage of males who qualified in 2008/9 was even lower. Out of a total of 32,945 students, only 22.7% of them were male. This is a drop of 2%.
There was also a large difference in the qualifications that students studied for. Most students qualified with a TEFL certificate; this was true for male students. The number of students who qualified with the TEFL was roughly three times (примерновтрираза) the number who qualified with a Cambridge UCLES CELTA or other degrees, although the total number of students qualifying with the TEFL dropped slightly, from 25,446 in 2007/8 to 24,917 a year later. There was a drop of 0.7% in the number of male students who gained this qualification.
In general it can be seen that the number of males qualifying as English language teachers is vastly outnumbered (to outnumber – превосходитьчислом)by females and that the proportion of male qualifiers is gradually dropping.
An example of graphs description
 There was a slow, steady increase
Sales increased steadily
There was a gradual rise
Sales rose gradually
There was a slow, steady increase
Sales increased steadily
There was a gradual rise
Sales rose gradually
|  There was a sharp increase in sales
Sales increased sharply
There was a considerable jump in sales
Sales increased sharply
There was a sharp increase in sales
Sales increased sharply
There was a considerable jump in sales
Sales increased sharply
|
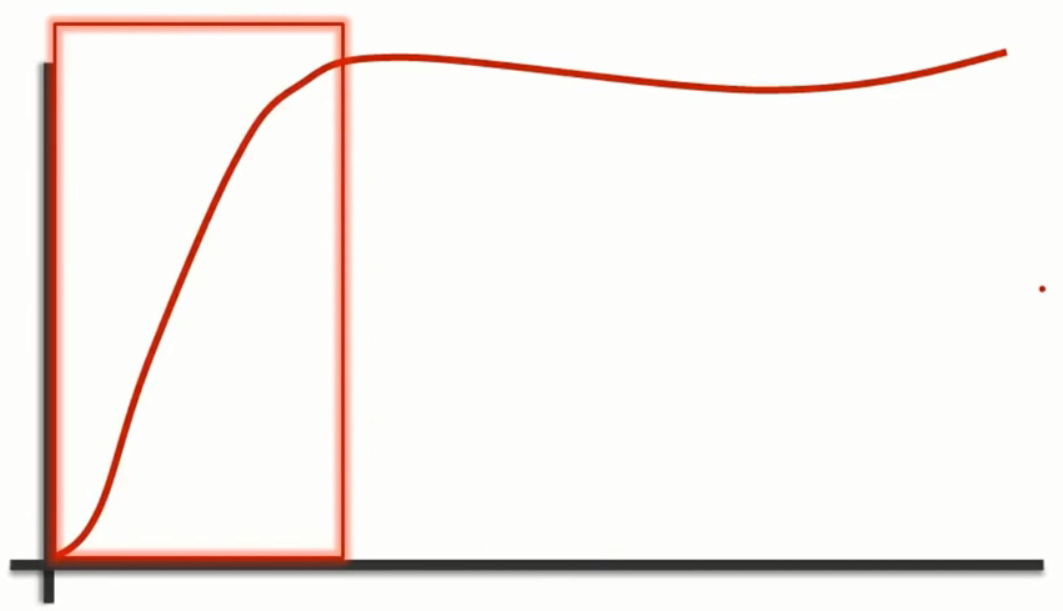
 There was a gentle steady increase
Sales increased gently
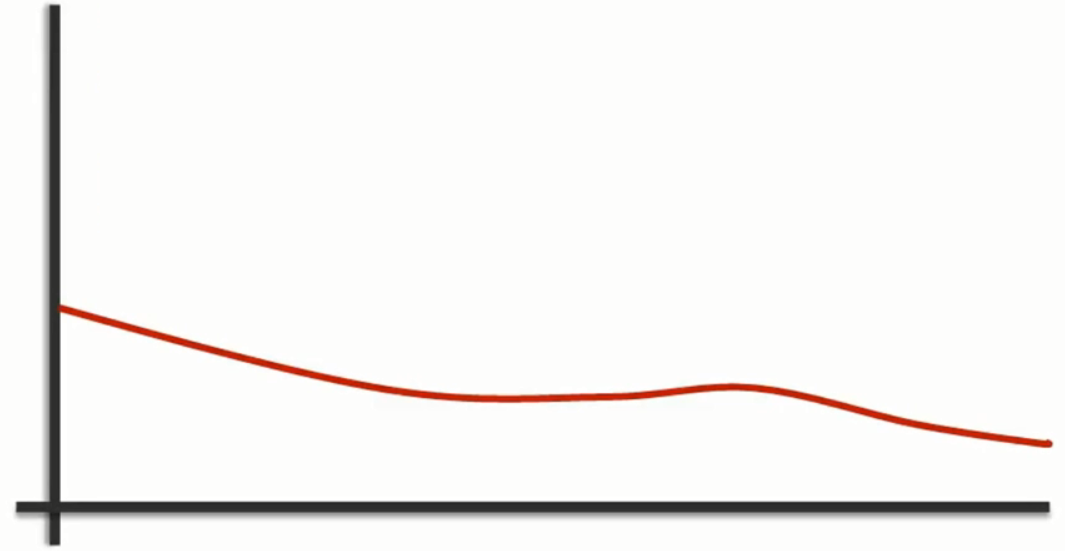
There was a gradual fall in sales
Sales fell gradually
There was a gentle steady increase
Sales increased gently
There was a gradual fall in sales
Sales fell gradually
|  Sales peaked at 10 000 units
There was a peak in sales at 10 000 units
Sales bottomed out at 1000 units
Sales hit a low of 1000 units
Sales peaked at 10 000 units
There was a peak in sales at 10 000 units
Sales bottomed out at 1000 units
Sales hit a low of 1000 units
|
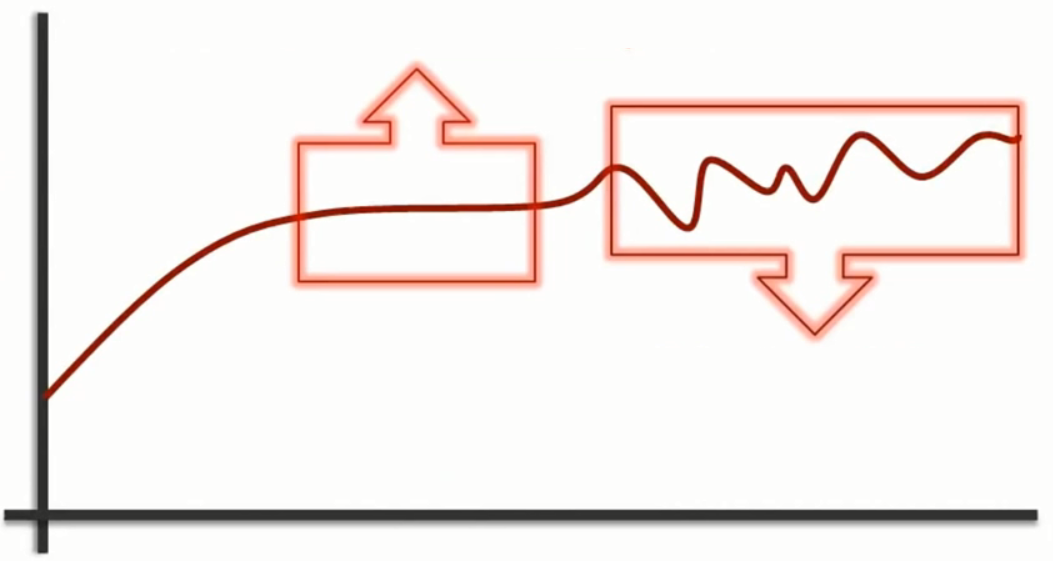 Sales levelled off and remained constant
Sales flattened out and stayed the same
Sales fluctuated Sales rose and fell
Sales levelled off and remained constant
Sales flattened out and stayed the same
Sales fluctuated Sales rose and fell
|  Sales increased in bits and starts over the year
Sales went unsteadily over the twelve month period
Sales rose erratically over the course of the year
Sales increased in bits and starts over the year
Sales went unsteadily over the twelve month period
Sales rose erratically over the course of the year
|
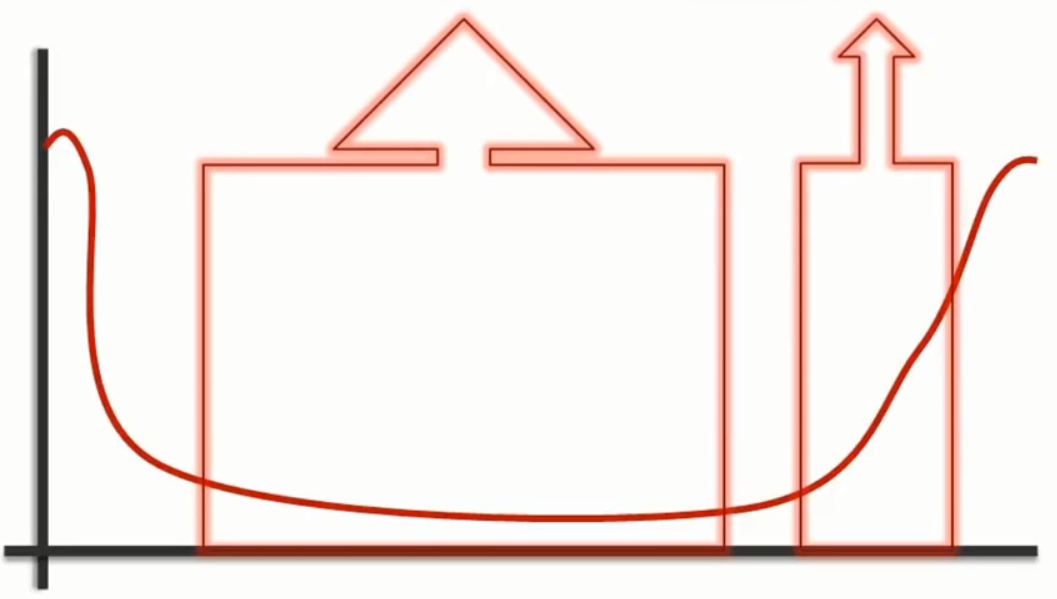 Sales stagnated for about seven months and then rose significantly
There was a seven month stagnation in sales and then there was an improvement
Sales stagnated for about seven months and then rose significantly
There was a seven month stagnation in sales and then there was an improvement
|