Planning for the future
· Operations
· Investments
· Financing
Ratio analysis - The process of examining various financial statement items with the objective of assessing the success of past and current performance and, perhaps more importantly, of projecting future performance and financial condition.
Analysis Approach
1. Comparisons across time Trend and time-series analysis
2. Cross-Sectional Analysis Within industry, Across sectors
3. Common-size financial statements Common-size income statement - as a percentage of revenue, Common-size balance sheet - as a percentage of total assets
4. Year-to-year growth analysis
5. Ratio analysis Enables inter-temporal and cross-sectional comparisons, Our primary focus
As a business owner, what performance indicators would you like to have?
As a business owner, what performance indicators would you like to have?
a) How fast are the revenues growing (Demand Analysis)? - Growth
b) What is the operating margin? - Profitability
c) What is the efficiency of asset usage? - Turnover
d) Do I have an optimal mixture of debt and equity financing? - Financial Leverage
Balance Sheet A summary of a firm’s financial position on a given date that shows total assets = total liabilities + owners’ equity.
Income Statement A summary of a firm’s revenues and expenses over a specified period, ending with net income or loss for the period.
Common-size analysis is the restatement of financial statement information in a standardized form.
Common-size analysis is an analysis of percentage financial statements where all balance sheet items are divided by total assets and all income statement items are divided by net sales or revenues.
Horizontal common-size analysis uses the amounts in accounts in a specified year as the base, and subsequent years’ amounts are stated as a percentage of the base value. 1 Useful when comparing growth of different accounts over time.
Vertical common-size analysis uses the aggregate value in a financial statement for a given year as the base, and each account’s amount is restated as a percentage of the aggregate. 1 Balance sheet: Aggregate amount is total assets. 2 Income statement: Aggregate amount is revenues or sales.
Financial ratio analysis is the use of relationships among financial statement accounts to gauge the financial condition and performance of a company.
Activity Ratios
Turnover ratios reflect the number of times assets flow into and out of the company during the period. It indicates quality of receivables and how successful the firm is in its collections.
A turnover is a gauge of the efficiency of putting assets to work.
Ratios:

Receivable Turnover Indicates quality of receivables and how successful the firm is in its collections
Inventory Turnover Indicates the effectiveness of the inventory management practices of the firm.
Payable Turnover (PT) Indicates the promptness of payment to suppliers by the firm.
Total Asset Turnover Indicates the overall effectiveness of the firm in utilizing its assets to generate sales.
Working Capital Turnover Indicates the effectiveness of the working capital management practices of the firm
The operating cycle is the length of time from when a company makes an investment in goods and services to the time it collects cash from its accounts receivable.
The net operating cycle is the length of time from when a company makes an investment in goods and services, considering the company makes some of its purchases on credit, to the time it collects cash from its accounts receivable.
The length of the operating cycle and net operating cycle provides information on the company’s need for liquidity: The longer the operating cycle, the greater the need for liquidity.
Operating Cycle Formulas


Accounts payable turnover = Cost of goods sold/ average account payable
Liquidity Ratios
Liquidity reflects the ability of a company to meet its short-term obligations using assets that are most readily converted into cash.
Assets that may be converted into cash in a short period of time are referred to as liquid assets; they are listed in financial statements as current assets.
Current assets are often referred to as working capital because these assets represent the resources needed for the day-to-day operations of the company's long-term, capital investments.
Current assets are used to satisfy short-term obligations, or current liabilities. The amount by which current assets exceed current liabilities is referred to as the net working capital
Liquidity is the ability to satisfy the company’s short-term obligations using assets that can be most readily converted into cash.
Liquidity ratios:
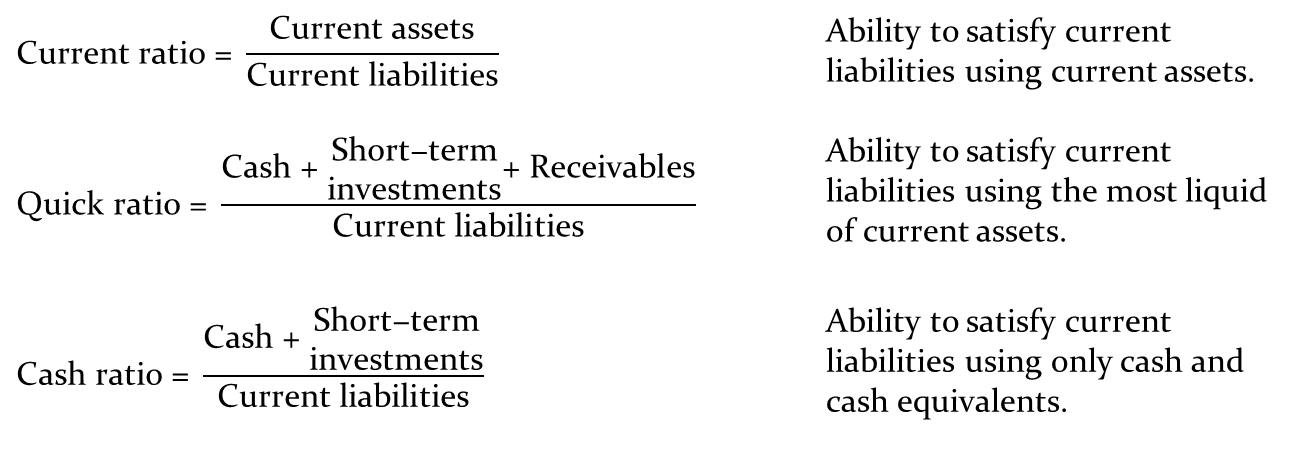
Generally, the larger these liquidity ratios, the better the ability of the company to satisfy its immediate obligations.
Is there a magic number that defines good or bad? Not really.
Consider the current ratio. A large amount of current assets relative to current liabilities provides assurance that the company will be able to satisfy its immediate obligations. However, if there are more current assets than the company needs to provide this assurance, the company may be investing too heavily in these non- or low-earning assets and therefore not putting the assets to the most productive use.
The net working capital to sales ratio is the ratio of net working capital (current assets minus current liabilities) to sales;
Indicates a company's liquid assets (after meeting short-term obligations) relative to its need for liquidity (represented by sales)
Net working capital to sales ratio = (Current assets - Current liabilities) / Sales
Net working capital = Current sales- Operating liabilities
How much liquidity a company needs depends on its operating cycle.
The operating cycle is the duration between the time cash is invested in goods and services to the time that investment produces cash.
For example, a company that produces and sells goods has an operating cycle comprising four phases:
purchase raw material and produce goods, investing in inventory;
sell goods, generating sales, which may or may not be for cash;
extend credit, creating accounts receivables, and
collect accounts receivables, generating cash.
A company with a long operating cycle may have more need to liquid assets than a company with a short operating cycle. That's because a long operating cycle indicate that money is tied up in inventory (and then receivables) for a longer length of time.
A company’s business risk is determined, in large part, from the company’s line of business.
Financial risk is the risk resulting from a company’s choice of how to finance the business using debt or equity.
We use solvency ratios to assess a company’s financial risk.

There are two types of solvency ratios: component percentages and coverage ratios.
Component percentages involve comparing the elements in the capital structure.
Coverage ratios measure the ability to meet interest and other fixed financing costs.

Economic balance
Assets
Net Working Capital Requirements (NWCR) = Current assets – Current liabilities (кроме notes payable)
Net fixes assets (long term assets)
Liabilities
Debt (notes payable + long term liabilities)
Shareholders’ equity
Profitability ratio
Margins and return ratios provide information on the profitability of a company and the efficiency of the company.
- A margin is a portion of revenues that is a profit.
- A return is a comparison of a profit with the investment/asset necessary to generate the profit.
Net profit margin = Net income / Sales
Operating profit margin = EBIT / Sales
Gross profit margin = (Sales- Cost of goods sold) / Sales
Pretax profit margin = EBT/ Sales
Earnings, (or net income,) are simply revenues minus costs. They are an accounting measure of profits.
Earnings would not be a good measure of economic profits given that the financial statements are subject to accounting rules.
Earnings measure the return to equity holders. The calculation subtracts debt interest payments and taxes owed.
Earnings Before Interest and Taxes (EBIT) is also an important measure of profit. It includes payments that go to debt holders and the tax authority.
Retained earnings are the earnings re-invested into the firm:
Retained earnings = earnings - dividends
The balance sheet can grow in one of three ways:
1. Internally, through retained earnings.
2. Externally by issuing new equity.
3. Externally by issuing new debt.
Return on equity (ROE) uses accounting values: earnings divided by book value of equity.
ROE will not be the same as the firms stock return over the period.
Given that ROE uses accounting earnings as the profit
measure, it is sensitive to the manipulations discussed above.
Earnings are measured over a period of time, (ie. year,) whereas the book value of equity on the balance sheet is at a specific point of time.
Return on assets (ROA) is another important measure of portability.
Again, ROA uses earnings to measure profit, but divides by the firm's book value.
ROA is insensitive to the firm's financing decision.
Thus, it is a measure of operating portability.
ROA = EBIT/ Total assets
ROE = Net income / Total equity
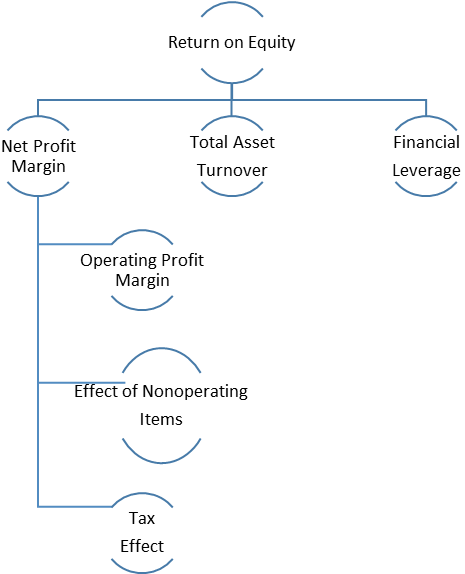
ROE = Net income/ Revenue (это Net profit margin) * Revenue/ Total assets (это Assets turnover) * Total assets/Equity (это fin leverage)
ROE = Total assets/Equity (это fin leverage) * Revenue/ Total assets (это Assets turnover) * Operating margin/ Revenue (это Operating profit margin) * Income before tax/Operating income(Это Non operating items)* (1- Taxes/Income before tax) {это tax effect}
EBITDA = Gross profit – Cash operating expenses
Gross profit = Sales- Cost of goods sold
EBIT = EBITDA – Depreciation –Amortization
EBT = EBIT – Interest
Net income (EAT) = EBT –Taxes
Cash operating expenses = marketing expenses, transportation expenses, wage expenses of selling, other selling expenses
Earning per share = Net income available to shareholders/ Number of common shares outstanding
Price to earning ratio = Price per share/ Earnings per share
Book value per share = Equity/ Number of shares
Divident per share = Divident paid to shareholders / Weighted available number of ordinary shares
Divident payout ratio = Divid paid to common shareholders/ Net income attribute to com. Shares
Plowback ratio = 1 – Div payout ratio
In addition to ratios, an analyst should describe the company (e.g., line of business, major products, major suppliers), industry information, and major factors or influences.
Effective use of ratios requires looking at ratios
— Over time.
— Compared with other companies in the same line of business.
— In the context of major events in the company (for example, mergers or divestitures), accounting changes, and changes in the company’s product mix.
Financial ratio analysis and common-size analysis help gauge the financial performance and condition of a company through an examination of relationships among these many financial items.
A thorough financial analysis of a company requires examining its efficiency in putting its assets to work, its liquidity position, its solvency, and its profitability.
We can use the tools of common-size analysis and financial ratio analysis, including the DuPont model, to help understand where a company has been.
We then use relationships among financial statement accounts in pro forma analysis, forecasting the company’s income statements and balance sheets for future periods, to see how the company’s performance is likely to evolve.