
OSCILLATORS
| Key terms | |
| 1. oscillator | — осциллятор — индикатор, который колеблется между верхней инижней границами коридора, обозначает сигналы «купи», «продай», указывая разницу между показателями среднего движения курса за короткий и длинный периоды времени. |
| 2. Momentum | — осциллятор, указывающий на скорость изменения цены в сравнении с уровнем самой цены. Разница между ценой инструмента сегодня и ценой в предшествующие периоды. Положительное или отрицательное значение разницы отмечается относительно нулевой линии. |
| 3. Relative Strength Index (RSI) | — осциллятор — индекс, обозначающий силу цены настоящей относительно цены в прошлом. |
| 4. Stochastics | — индикатор скорости изменения цен. На растущем рынке цены при закрытии биржи устремляются вверх, и наоборот, при понижательной рыночной конъюнктуре они падают вниз. |
| Slow stochastics | — дает менее чувствительные показатели движения цен и более предпочтителен для торговцев. Его показатель % К соответствует % D быстрых стохастических линий. |
| Fast stochastics | — индикатор более чувствительный, чем медленные стохастические линии, линия % показывает близость цен закрытия биржи к верхней границе за определенный период. Масштаб измерения — от 0 до 100. Наивысшая цена — 100, самая низкая — 0. % D — вторая линия, специальная линия показателей среднего движения курса % К по различным периодам. Сигнал покупки образует комбинация низкого значения % D и еще более низкого значения % К (менее 20). Сигнал продажи — высокое значение % D и еще более высокое % К (более 80). |
| 5. Moving Average Convergence Divergence (MACD) | — две линии показателей среднего движения курса, колеблющиеся выше и ниже нуля. Первая линия (Conv.) отмечает разницу между показателями среднего курса (MACD W), а вторая является экспонентным показателем среднего курса первой линии (MACD), т.е. сигнальной линией. Если MACD W пересечет сигнальную линию сверху, то возникает сигнал покупки. Если пересечение произойдет с противоположной стороны — то возникает сигнал продажи. Чем пересечение дальше от нуля, тем прогноз надежнее. |
| 6. Moving Average Crossover | — пересечение скользящих средних с коротким и длинным периодом образует две линии показателей среднего движения курса. Если курс с коротким периодом падает ниже курса с длинным периодом и оба курса снижаются, то образуется сигнал продажи. Если курс короткого периода пересекает курс длинного периода снизу и оба курса поднимаются вверх, то образуется сигнал покупки. |
| 7. Bollinger Bands | — линии, наносимые на график выше и ниже скользящей средней цен закрытия. Верхняя и нижняя линии сближаются при спокойной конъюнктуре рынка и расходятся с ростом колебания цен. |
| 8. Directional Movement Index —индекс, образуемый четырьмя индексами и указывающий на силу тренда. |
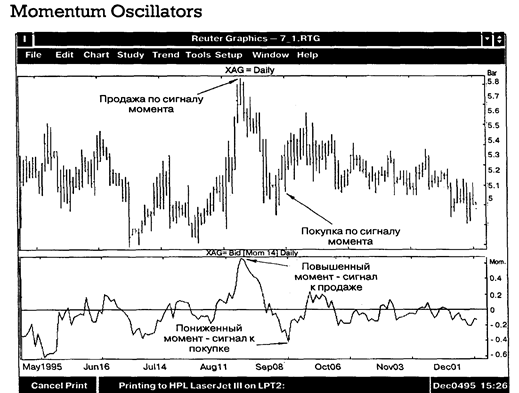
| Momentum oscillators are technical indicators which measure the change in prices over a given time period. These indicators are very useful in trendless or sidewavs trending markets, as well as in trading band conditions. They can also help in oinoointing the turn in trends, whether they be intra-day, weekly, or very long term in nature. During a trending period though, the trend will tend to dominate any signals given by the momentum oscillator. There are three important indications to look for in all momentum oscillators: direction. extreme values and divergence from prices. Direction Momentum oscillators track prices verv well. and can actually lead price direction bv one to two periods. The direction | Vocabulary ae 'value - ценность, цена, сумма э: divergence - отклонение i: to'lead - упреждать crossover — пересечение |
| that momentum oscillators are moving in thus corresponds to the direction in which prices will potentially move. Longer term versus shorter term momentum oscillator analysis provides indication of price direction as well. This is similar to the use of long and short term moving averages for determining nrice direction, in that cross overs are very important. A longer term momentum oscillator is one that uses a larger time period. relative to a medium term momentum oscillator. For example, a 21-day Stochastic would be considered a long term momentum oscillator, compared to a 9-day stochastic, and a 10-bar hourly stochastic would be considered a longer term stochastic in comparison to a 5-bar hourly stochastic. As a rule: "The longer term momentum oscillators have less volatility and thus they will not be subject to the number of false |
| signals that the shorter term momentum oscillators are, making a case for using them in conjunction with each other. The same effect can be generated bv smoothing a same time period oscillator, in effect slowing it down. In this case, a moving average of a momentum oscillator can be compared to the underlying momentum oscillator, and give similar cross over signals as using the longer term/shorter term indicators. Extreme Values An extreme value in the momentum oscillator occurs, when peaks and troughs are evident in the momentum oscillator chart. When the momentum oscillator reaches an extreme value, the trend in prices will generally flatten, and there is potential for a reversal of the prior trend. However, the prevailing trend of price direction is still the major trading factor, and momentum oscillators reaching extreme values is usually a pause in the trend. Areas of extreme value are called overbought levels at momentum oscillator peaks, and oversold levels at momentum oscillator troughs. Both the Relative Strength Index and the Stochastic indicator have predetermined levels where the underlying instrument is considered to be overbought or oversold, but as peaks tend to occur at higher levels in bull markets, troughs at lower levels in bear markets, the use of predetermined levels for overbought/oversold signals is not encouraged. Other momentum oscillators such as the Net Change Oscillator (NCO) or Rate of Change Indicator (ROC) display peaks and troughs as well, but there are no predetermined valuation levels which give overbought/oversold indications. Divergence As prices and momentum oscillators usually trend in the same direction, and momentum oscillators can be used for the timing of price turns, divergence in direction is an important sianal. Divergence occurs when prices continue to trend higher (or lower) and momentum oscillators turn in the opposite direction. This is most significant at new price highs or lows, but keep in mind that chart patterns such as double tops, head and shoulders, etc. can occur when divergence is seen, and one should wait for penetration of kev suooort. or resistance, in order to confirm this turn in the trend. Divergence can be used to tighten stops, or as a strong warning signal that the prevailing trend could be reversing. These three indications are verv important in using momentum oscillators, as used in conjunction with each other thev can help in determining trends and turning points. Moving Average Spreads (MAS) The formula of the moving average spread is: MAS = shorter moving average - longer moving average Example: (4-day MA) — (18-day MA), or (5-week MA) - (20-week MA). Moving average spreads are derived by taking the difference between two moving averages. Usually one of the moving averages is a short term moving average, while the other can be intermediate, or long term. This difference, or spread, is plotted and used as a momentum oscillator. | л | |
| 'underlying | - основной | |
| of | ||
| 'trough | — нижняя точка (поддержка) | |
| i: | ||
| 'peak | — высшая точка (сопротивления) | |
| QT dl | ||
| 'prior | — предшествующий | |
| e | ||
| spread | — разница, разрыв | |
| pre-set | — заранее установленный | |
| ae | ||
| 'magnitude | — величина, значение | |
| to overlay | — наложить | |
Moving average spreads are plotted as any momentum oscillator. Direction, extreme values and divergence are looked for in the chart. If the spread is uptrending, the shorter term moving average must be greater than (above) the longer term moving average. The reverse is true for a downtrending spread. Trading signals are generated when the zero line is crossed, showing a moving average cross over. Thus, moving average spreads are good trend indicators.
Extreme values are a little harder to measure in the moving average spreads as there are no pre-set boundaries. The Relative Strength Indicator and Stochastic Oscillator have maximum and minimum values (100 and 0) and levels at which the market is considered overbought/oversold (70% - 30% and 80%-20%, respectively). The MAS, much like the NCO, does not have either of these pre-determined parameters. It can take on any value, positive or negative, of any magnitude. Analysing historical data of past extreme values is necessary, and then these areas can be used for future reference.
Divergence between MAS direction and security price direction gives early indication of trend change. One measure of trend change that is often used in technical analysis is the crossing of moving averages. Crossing of the moving averages which make up the spread necessarily makes the MAS reach zero. Thus, early warning or confirmation of a change in trend is possible using MAS.
Comprehension Questions
1. What do momentum oscillators measure?
2. What are the three important indications in all momentum oscillators?
3. How do momentum oscillators show direction of price moves?
4. Which M. 0's produce false signals?
5. How can M. 0's indicate a reversal of the prior trend?
6. What are the areas of extreme value called?
7. When does divergence occur?
8. What is the formula of Moving Average Spreads?
Exercises
Ex. 1. Put questions to the underlined words.
Ex. 2. Find verbals and state their syntactical function in the sentence.
Ex. 3. Select sentences which are difficult to translate and make a syntactical analysis of them.
Ex. 4. Analyse noun collocations according to the models given in the Reference Grammar.
Ex. 5. Read and translate the text.
| TRANSLATION PRACTICE Momentum Crossover Analysis The Momentum Crossover analysis, which can be created in the User defined analysis modules of Reuters Technical Analysis and Reuters Technical Analysis for Unix, combines the trend direction characteristics of the simple moving average and the trend strength capabilities of the momentum analysis. Two of these analyses used together can produce effective buy and sell signals. | Vocabulary ou crossover trend direction - trend strength - | пересечение (трендов) - направление тренда - сила тренда |

| The formula parameters are as follows and need to be filled in at the time of charting: vl —timeseries (instrument), nl — observation period for momentum (lag period), n2 — averaging period for moving average. The diagram shows a short and long momentum crossover analysis giving clear buy and sell signals. The momentum crossover analysis is simply a smoothed version of the standard momentum analysis. Two of these analysis on the same chart, one with a long, the other with a short averaging period can be used in the same way as two standard simple movine averages, (i.e. crossover indicates buy and sell signals) except that the lines will oscillate around zero. Uptrends are indicated bv price action below the momentum crossover lines. The momentum crossover line cutting through price after a trend has been established (up or down) indicates trend reversal. The analysis should not be used in a sudeways market as it tends to be choppy in the same manner as ordinary moving averages. To create the Momentum crossover analysis, simply add the following formula into the UDA editor of either RTA or RTAu. Then graph the momentum crossover twice with differing length averaging and observation periods overlaid with a price chart. The momentum and moving average oeriod parameters should be the same as those used for short and long moving average crossovers for the instrument you are trading. Exercises Ex. 1. Put questions to the underlined words. Ex. 2. Find verbals and state their syntactical function in th Ex. 3. Analyse noun collocations. | e momentum — скорость изменения цены moving average — скользящая средняя lag - отставание во времени и: 'smoothed - сглаженный о to'oscillate - колебаться ou ei to overlay — наложить e sentence. |

| OSCILLATORS (continued) Relative Strength Index (RSI) The formula for the RSI is: RSI = 100— 100/[(Up Average/Down Average) + I]. Where: Up Average = The average of closes in a given amount of time that are higher than the previous close. Down = The average of closes in a given amount of time that are lower than the previous close. The RSI is a momentum indicator based upon price movement over a specified period of time created by Welles Wilder. Some of the Droblems that are apparent in other momentum oscillators are eliminated in the RSI. Namely, by taking the up average and down average instead of the difference of prices, a smoother oscillator is created. For example, in a 14-day RSI the up average of the last 14 days is derived, as is the down average of the last 14 days. A constant band is created as well (from 0 to 100) which facilitates analysis of different securities. The RSI is used as any momentum oscillator. Directional movement, peaks, troughs. Divergence and crossing between short term and long term RSI's are looked for in the chart. Overbought/oversold signals are given by crossing the 70 and 30 lines according to Welles Wilder. Instead of focusing only on the crossing of the overbought/oversold line, peaks and troughs of the oscillator should be examined for signals, with peaks expected to be at higher levels in a bull market than in a bear market, troughs occurring at lower levels in a bear market than a bull market. A peak in the RSI would suggest a price turn around to lower levels could be ahead, while a trough in the RSI suggests the opposite. Longer term RSI's will have less vitality than shorter term RSI's, if many overbought/oversold signals are desired, use of a shorter term RSI would generate them, but these will not have the same weight as the less sensitive RSI in terms of medium to long term trends. | Vocabulary |
| e | |
| momentum - скорость движения | |
| i | |
| to eliminate — уничтожать, снимать | |
| u: | |
| smooth — гладкий, ровный | |
| ai | |
| to derive - получать | |
| э: | |
| raw — грубый |

The stochastic recognizes that in an uptrending market the close tends to be near high, while in a downtrending market, the
close is near the lows of the time period. Using the above formula, a "raw" stochastic is found.
A three—day moving average of the "raw" stochastic is used by MMS, as the "raw" stochastic is very volatile, giving false signals. The three—day moving average is called the %K stochastic. A three—day moving average of the %K stochastic is called the %D, which gives a smoother momentum oscillator. This indicator will range between 100 (when the close is equal to the highest high of the last "x" periods) and 0 (when the close is equal to the lowest low of the last "x" periods).
The stochastic is used as any momentum oscillator, with directional movement, peaks, troughs, divergence, crossing between short term and long term stochastics, and crossing between %K and %D stochastics looked for in the chart.
Bollinger Bands—BB
Bollinger Bands are lines charted above and below the moving average of the closing prices. This analysis varies from other percentage band analysis because the distance of each band from the moving average is not fixed. Instead, the price channel these bands form around the moving average is flexible and determined by the user specifying a number of standard deviations.
The standard deviation is the method used to set the band width about the moving average. Bollinger used a 2% standard deviation to capture 95% of prices within the band. However a 1.5 standard deviation is commonly used for futures.
Bollinger Bands automatically narrow and widen in response to volatility — narrow in calm markets, and widen in volatile markets, making them an effective trend indicator.
Bollinger Bands are used with a simple price graph:
Prices near the lower band may signal an overbought market.
Prices near the upper band may signal an oversold market.
The bands often narrow before a sharp move in price. A narrowing of the bands indicates the start of a new trend, which is confirmed when prices break and close out of the band.
A price that breaks above the top band, followed by another that closes within, may signal a reversal and a good time to sell.
A price that breaks below the bottom band, followed by another that closes within, may signal a reversal and a good time to buy.
Example
If prices are moving in a downtrend and hit the bottom of the band, but close back in the bands, indicates that the trend will not continue to go down but sideways and then probably back up.
Bollinger Bands form an area of Support and Resistance and are used to take profits. If prices break above or below the Bands, it results in a changed Support and Resistance. Bollinger Bands do not indicate trading stops.
Directional Movement Index — DMI
The Directional Movement Index (DMI) determines the strength of any upward or downward trends present in the market. It consists of the following four lines:
+DM measures upward movement in price over time. — DM measures downward movement in price over time. DX measures the overall direction of movement
(whether up/down) in price over time. ADX measures the average direction of movement (up/
down) in price over time. In effect it is the average
of the DX.
ADX measures the strength of the trend in the market. The higher the ADX, the stronger the trend present. This index does not measure the direction of the trend. In other words, it is quite common for the ADX to be rising while prices are falling — this indicates an increasing strength in the down trend.
All four lines are plotted on a scale from 0 to 100.
Comprehension questions
1. Where are Bollinger Bands charted?
2. What does the band width show?
3. What do Bollinger Bands signal?
4. What does the Directional Movement Index show?
Exercises
Ex. 1. Translate from English into Russian and vice versa
1. What are the momentum oscillators?
Momentum oscillators are technical indicators which measure the change in price over a given time period.
2. Where are M.O's used?
They are useful in trendless or sideways trending market, and significant when they reach extreme value:
overbought + 70/80%, oversold - 30/20%.
3. What signals do they give?
M.O's give market signals. Turn divergence between prices and momentum.
4. What is a Relative Strength Index?
Relative Strength Index (RSI) is a smoother oscillator created by taking the up average and down average instead of the difference in prices.
5. What is the formula for RSI?

6. What does a stochastic oscillator measure? A stochastic oscillator measures where closing price is in relation to total price range.
7. Where are closing prices in uptrend?
Uptrend closing prices are in the upper end of the range.
8. What lines does a stochastic oscillator use? Two lines are used: %K line, more solid and sensitive and %D line, smoothed version of the %K line.
9. What is the formula for a stochastic oscillator?
The Formula is %K = 100 C-Lx/Hx-Lx],
Lx — Lowest low of last x period,
Hx — Highest high of last x period,
%D = Moving average of %K 3 day smoothed is used
with 5 day. An example of the stochastic oscillator is shown below:

Ex. 2. Put questions to the underlined words.
Ex. 3. Find verbals and state their syntactical function in the sentence.
Ex. 4. Make a syntactical analysis of the sentences difficult for translation.
Ex. 5. Read and translate the text.
TRASLATION PRACTICE
| A Quick Look At Bollinger Bands Bollinger bands is a popular band analysis similar to the Alpha Beta trend. It can be used as a system in itself or with Oscillators such as the Relative Strength Index (RSI). The analysis is standard in both Reuters Technical Analysis (RTA) and Reuters Technical Analysis for Unix (RTAu). Bollinger Bands consist of 3 lines. 2 charted ones above and the other below the moving average of closing prices, which makes up the third line. The moving average of close data needs to be created seoaratelv to complete the bollineer bands analysis. This analysis varies from other percentage band analyses because the distance of each band from the moving average is not fixed. Instead, the price channel these bands form around the moving average is flexible, being determined by specifying a number of standard deviations from it. John Bollineer. who created Bollineer Bands and used them in stock tradine. Used a standard deviation of 2 which captures about 95% of price action within the bands. A different number of standard deviations can be selected dependina on the market traded for example, 1.8 standard deviations would be more appropriate for futures trading. The length of the moving average which is used to calculate the bands is usually 20 days or less. Care should be taken here as these sample sizes are small and statistical error Quite possible. The only statistical inference that should be drawn from this analysis is that most (approx. 95%) of the price action will be contained. A useful feature of Bollinger Bands is automatic narrowing and widening in response to volatility — narrow in calm markets and wide in volatile markets. This makes them an effective trend indicator, especially when used in conjunction with another trend following tool. Trading Rules Use Bollinger Bands with a price chart and simple moving average (the same length as the Bollinger Bands) then keep a look out for the following signals: Fig 1 Bollinger Bands(top) used with an RSI(bottom). Trendlines show divergence between the RSI and Price which confirms the Bollinger Bands. Prices near the lower band may signal an oversold market. Prices near the upper band may signal an overbought market. The bands often narrow before a sharp move in price, either ud or down. A narrowing of the bands often indicates the start of a new trend, which is confirmed when prices break and close out of the band. An interval that closes above the top band, followed by another that closes within, may signal a reversal and a good time to sell. | Vocabulary | |
| i: ei | ||
| deviation — отклонение | ||
| ae | ||
| to'capture — охватывать | ||
| э | ||
| appropriate — подходящий | ||
| to take care — позаботиться | ||
| a: | ||
| sample — образец | ||
| i | ||
| 'inference — вывод | ||
| ei | ||
| to contain — содержать | ||
| to keep a | ||
| lockout — следить | ||
| trend reversal — смена тренда | ||
| э: | ||
| to confirm — подтверждать | ||
| э: | ||
| divergence — отклонение | ||
| A to comfort — успокаивать | ||