Видео https://youtu.be/4R8xm19DmPM
0:00 Let's look at an introduction to the normal distribution also known as the Gaussian distribution.
 The normal distribution is an extremely important continuous probability distribution.
It arises very, very frequently in theory and practice.
0:18 Here I've plotted out what is approximately the distribution of the height of adult Canadian males and this what we see here is a normal distribution.
This is our variable down here and f of X is what we call the probability density function which gives the height of the curve at point X.
0:40 Here's the equation for the probability density function of the normal distribution.
We're not going to be working with this directly very often but there's a few points we should note.
0:49 First of all if the random variable X has a normal distribution then it can take on any finite value.
0:57 There are two parameters to this distribution.
Mu is the mean of the distribution and the mean can take on any finite value as well.
Sigma is the standard deviation and Sigma squared of course is the variance.
Sigma has to be some positive value and of course Sigma squared would have to be some positive value as well.
1:24 Here's a normal distribution plotted out.
Mu the mean is also right smack dab in the middle of the distribution.
The distribution is symmetric about mu.
So mu represents the mean of the probability distribution and it's also the median of the probability distribution.
Now let's try and get some perspective for what Sigma represents.
1:49 Here I've plotted in one standard deviation below the mean to one standard deviation above the mean and as we'll see a little bit later on this area between one standard deviation below to one standard deviation above is approximately zero point six eight 68% of the area lies within one standard deviation of the mean.
2:13 Here I've plotted in mu minus 2 standard deviations 2 mu plus 2 standard deviations and approximately 95% of the area lies within two standard deviations of the mean and approximately 99.7% of the area lies within three standard deviations of the mean.
 2:41 Here's another plot to give us a little perspective on what Sigma represents.
Over here this red line represents a normal distribution with a standard deviation of Sigma 2 and this white curve represents a normal distribution with the standard deviation of Sigma 1 but Sigma 2 is double Sigma 1 so the standard deviation on the red curve is double the standard deviation of the white curve and we can see that when the standard deviation is greater there is more area in the tails and a lower peak.
3:16 There are an infinite number of different normal distributions corresponding to all the different possible values for MU and Sigma.
If X is a random variable that has a normal distribution with mean mu and variance Sigma squared we write this as the random variable X is distributed normally with a mean of mu and a variance of Sigma squared.
X is distributed normally a big N first term is the mean second term is the variance.
Be a bit careful here as different sources can have a different term in here sometimes people have the second term representing the standard deviation I have the second term representing the variance.
So just be a bit careful with that.
4:07 By definition the standard normal distribution is a normal distribution with the mean of 0 and a variance of 1.
We often represent random variables that have the standard normal distribution with the letter Z and yes I am Canadian and we might say if Zedd has a standard normal distribution we might write this as Zedd is distributed normally with a mean of 0 and a variance of 1 that being mu that being Sigma squared and if the variance of is 1 of course Sigma is 1 as well.
4:46 As we will soon see we very often need to find areas under the standard normal curve.
Probabilities are simply areas under the curve and very often the question of interest involves finding a probability.
5:01 Finding probabilities and percentiles for the normal distribution requires integrating the probability density function.
There isn't a closed form solution and it must be integrated numerically.
Fortunately for us we're going to use software or a standard normal table to actually find these values in practice.
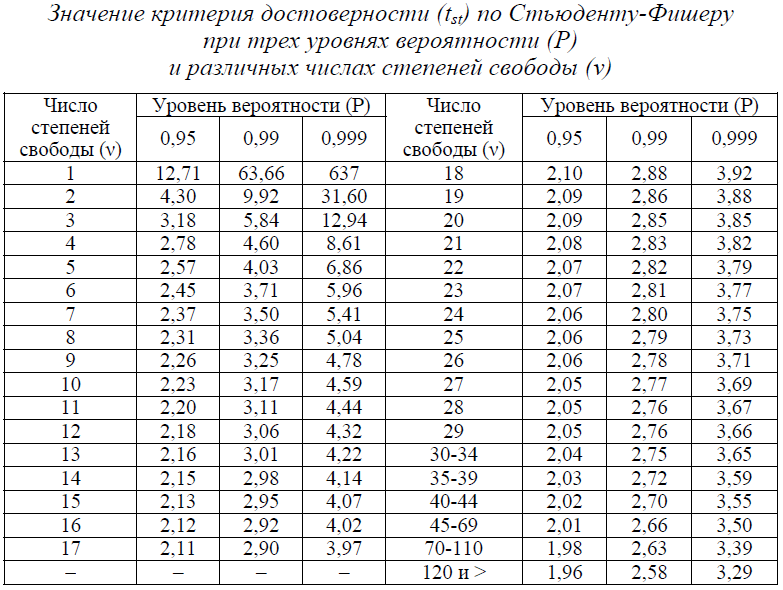
Приложение 3
Таблица Стьюдента
Приложение 4
Таблица Фишера при уровне значимости α=0,05
| α=0,05 | νМГ | ||||||||||||
| νВГ | 161,45 | 199,5 | 215,71 | 224,58 | 230,16 | 233,99 | 236,77 | 238,88 | 240,54 | 241,88 | 242,98 | 243,91 | |
| 18,51 | 19,00 | 19,16 | 19,25 | 19,30 | 19,33 | 19,35 | 19,37 | 19,38 | 19,40 | 19,40 | 19,41 | ||
| 10,13 | 9,55 | 9,28 | 9,12 | 9,01 | 8,94 | 8,89 | 8,85 | 8,81 | 8,79 | 8,76 | 8,74 | ||
| 7,71 | 6,94 | 6,59 | 6,39 | 6,26 | 6,16 | 6,09 | 6,04 | 6,00 | 5,96 | 5,94 | 5,91 | ||
| 6,61 | 5,79 | 5,41 | 5,19 | 5,05 | 4,95 | 4,88 | 4,82 | 4,77 | 4,74 | 4,70 | 4,68 | ||
| 5,99 | 5,14 | 4,76 | 4,53 | 4,39 | 4,28 | 4,21 | 4,15 | 4,10 | 4,06 | 4,03 | 4,00 | ||
| 5,59 | 4,74 | 4,35 | 4,12 | 3,97 | 3,87 | 3,79 | 3,73 | 3,68 | 3,64 | 3,60 | 3,57 | ||
| 5,32 | 4,46 | 4,07 | 3,84 | 3,69 | 3,58 | 3,50 | 3,44 | 3,39 | 3,35 | 3,31 | 3,28 | ||
| 5,12 | 4,26 | 3,86 | 3,63 | 3,48 | 3,37 | 3,29 | 3,23 | 3,18 | 3,14 | 3,10 | 3,07 | ||
| 4,96 | 4,10 | 3,71 | 3,48 | 3,33 | 3,22 | 3,14 | 3,07 | 3,02 | 2,98 | 2,94 | 2,91 | ||
| 4,84 | 3,98 | 3,59 | 3,36 | 3,20 | 3,09 | 3,01 | 2,95 | 2,90 | 2,85 | 2,82 | 2,79 | ||
| 4,75 | 3,89 | 3,49 | 3,26 | 3,11 | 3,00 | 2,91 | 2,85 | 2,80 | 2,75 | 2,72 | 2,69 | ||
| 4,67 | 3,81 | 3,41 | 3,18 | 3,03 | 2,92 | 2,83 | 2,77 | 2,71 | 2,67 | 2,63 | 2,60 | ||
| 4,60 | 3,74 | 3,34 | 3,11 | 2,96 | 2,85 | 2,76 | 2,70 | 2,65 | 2,60 | 2,57 | 2,53 | ||
| 4,54 | 3,68 | 3,29 | 3,06 | 2,90 | 2,79 | 2,71 | 2,64 | 2,59 | 2,54 | 2,51 | 2,48 | ||
| 4,49 | 3,63 | 3,24 | 3,01 | 2,85 | 2,74 | 2,66 | 2,59 | 2,54 | 2,49 | 2,46 | 2,42 | ||
| 4,45 | 3,59 | 3,20 | 2,96 | 2,81 | 2,70 | 2,61 | 2,55 | 2,49 | 2,45 | 2,41 | 2,38 | ||
| 4,35 | 3,49 | 3,10 | 2,87 | 2,71 | 2,60 | 2,51 | 2,45 | 2,39 | 2,35 | 2,31 | 2,28 | ||
| 4,17 | 3,32 | 2,92 | 2,69 | 2,53 | 2,42 | 2,33 | 2,27 | 2,21 | 2,16 | 2,13 | 2,09 | ||
| 4,00 | 3,15 | 2,76 | 2,53 | 2,37 | 2,25 | 2,17 | 2,10 | 2,04 | 1,99 | 1,95 | 1,92 | ||
| 3,92 | 3,07 | 2,68 | 2,45 | 2,29 | 2,18 | 2,09 | 2,02 | 1,96 | 1,91 | 1,87 | 1,83 |
Приложение 5
Таблица Пирсона (хи-квадрат)
| ν=3 | ν=4 | ν=5 | ν=6 | ν=7 | ν=8 | ν=9 | ν=10 | ν=11 | ν=12 | |
| α=0,05 | 7,81 | 9,49 | 11,07 | 12,59 | 14,07 | 15,51 | 16,92 | 18,31 | 19,68 | 21,03 |
| α=0,95 | 0,35 | 0,71 | 1,15 | 1,64 | 2,17 | 2,73 | 3,33 | 3,94 | 4,57 | 5,23 |
| α=0,99 | 0,11 | 0,3 | 0,55 | 0,87 | 1,24 | 1,65 | 2,09 | 2,56 | 3,05 | 3,57 |
Приложение 6