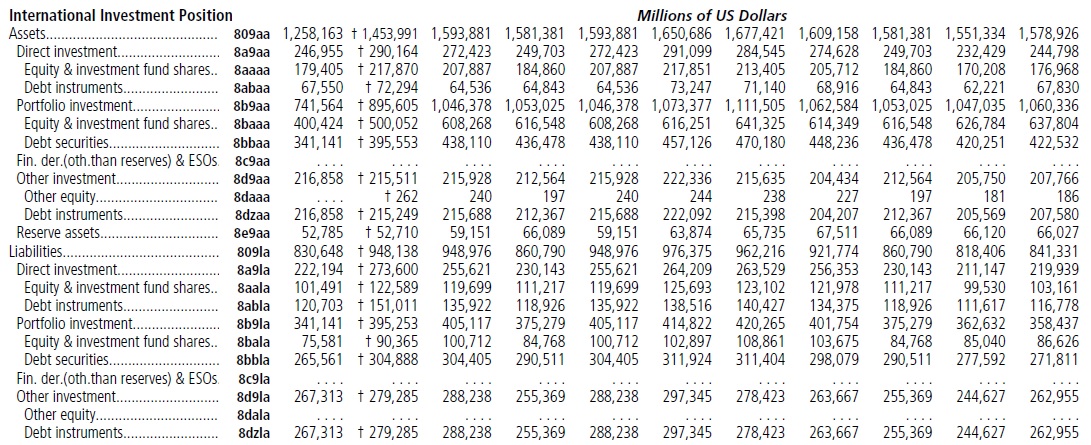
Таблица 1
Международная инвестиционная позиция Норвегии, млн. крон
| 2012K1 | 2012K4 | 2013K4 | 2014K4 | 2015K4 | ||
| Assets | 3.1 Direct investment | |||||
| 3.1.1 Equity and Investment Fund shares | ||||||
| 3.2 Portofolio investment | ||||||
| 3.2.1 Equity and Investment Fund shares | ||||||
| 3.4 Other investments | ||||||
| 3.4.1 Other equity | ||||||
| 3.4.2 Currency and deposits | ||||||
| 3.4.2.RS.1 Central bank | ||||||
| 3.4.2.RS.2 Other MFIs | ||||||
| 3.4.2.RS.3 General government | ||||||
| 3.4.2.RS.4 Other sectors | ||||||
| 3.4.3 Loans | ||||||
| 3.4.3.RS.1 Central bank | ||||||
| 3.4.3.RS.2 Other MFIs | ||||||
| 3.4.3.RS.3 General government | ||||||
| 3.4.3.RS.4 Other sectors | ||||||
| 3.4.5 Trade credits and advances | ||||||
| 3.4.6 Other accounts recievable/payable | ||||||
| 3.4.6.RS.1 Central bank | ||||||
| 3.4.6.RS.2 Other MFIs | ||||||
| 3.4.6.RS.3 General government | ||||||
| 3.4.6.RS.4 Other sectors | ||||||
| 3.5 Reserve assets (IMF breakdown) | ||||||
| 3.5.2 Assets - Special Drawing Rights | ||||||
| 3.5.3 Reserve position in the IMF | ||||||
| 3.5.4 Other reserve assets | ||||||
| 4 NET ASSETS | ||||||
| Liabilities | 3.1 Direct investment | |||||
| 3.1.1 Equity and Investment Fund shares | ||||||
| 3.2 Portofolio investment | ||||||
| 3.2.1 Equity and Investment Fund shares | ||||||
| 3.4 Other investments | ||||||
| 3.4.1 Other equity | ||||||
| 3.4.2 Currency and deposits | ||||||
| 3.4.2.RS.1 Central bank | ||||||
| 3.4.2.RS.2 Other MFIs | ||||||
| 3.4.2.RS.3 General government | ||||||
| 3.4.3 Loans | ||||||
| 3.4.3.RS.1 Central bank | ||||||
| 3.4.3.RS.2 Other MFIs | ||||||
| 3.4.3.RS.3 General government | ||||||
| 3.4.3.RS.4 Other sectors | ||||||
| 3.4.5 Trade credits and advances | ||||||
| 3.4.6 Other accounts recievable/payable | ||||||
| 3.4.6.RS.1 Central bank | ||||||
| 3.4.6.RS.2 Other MFIs | ||||||
| 3.4.6.RS.3 General government | ||||||
| 3.4.6.RS.4 Other sectors | ||||||
| 3.4.7 Liabilities - Special Drawing Rights | ||||||
| 3.5 Reserve assets (IMF breakdown) | ||||||
| 4 NET ASSETS | .. | .. | .. | .. | .. |
Таблица 2
Международная инвестиционная позиция Норвегии, млн. крон
| 4Q 2014 | 1Q 2015 | 2Q 2015 | 3Q 2015 | 4Q 2015 | |
| Foreign ASSETS | |||||
| Direct investment | |||||
| Equity and Investment Fund shares/units | |||||
| Debt instruments | |||||
| Portofolio investment | |||||
| Equity and Investment Fund shares | |||||
| Equity securities | |||||
| Investment Fund shares | |||||
| Debt securities | |||||
| Other investments | |||||
| Other equity | |||||
| Currency and deposits | |||||
| Loans | |||||
| Trade credits and advances | |||||
| Other accounts recievable/payable | |||||
| Reserve assets (IMF breakdown) | |||||
| Assets - Special Drawing Rights (SDRs) | |||||
| Reserve position in the IMF | |||||
| Other reserve assets | |||||
| LIABILITIES | |||||
| Direct investment | |||||
| Equity and Investment Fund shares/units | |||||
| Debt instruments | |||||
| Portofolio investment | |||||
| Equity and Investment Fund shares | |||||
| Equity securities | |||||
| Investment Fund shares | |||||
| Debt securities | |||||
| Other investments | |||||
| Other equity | - | - | - | - | - |
| Currency and deposits | |||||
| Loans | |||||
| Trade credits and advances | |||||
| Other accounts recievable/payable | |||||
| Liabilities - Special Drawing Rights (SDRs) | |||||
| NET ASSETS |
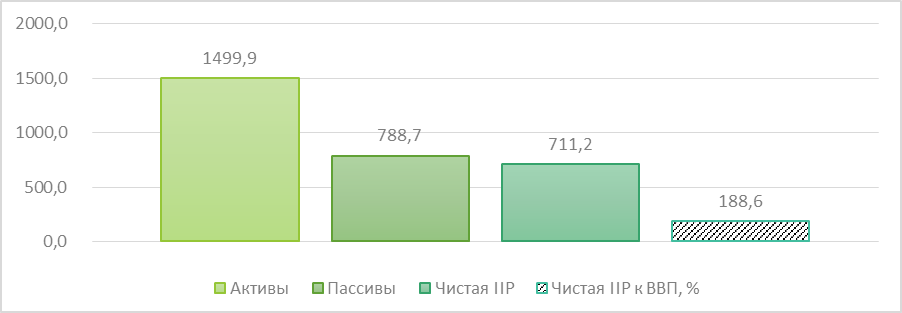
Рис. Международная инвестиционная позиция, 2014 г. млн. евро
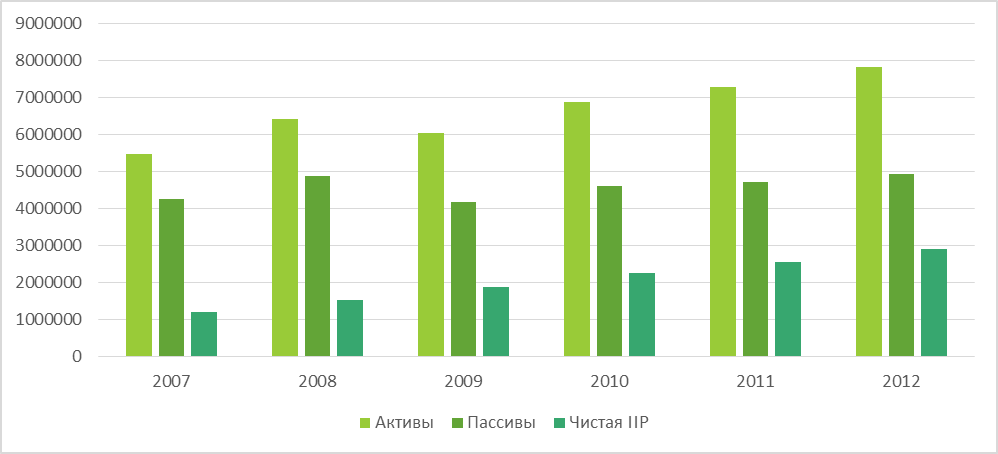
Рис. Международная инвестиционная позиция, 2007-2012 гг. млн. крон
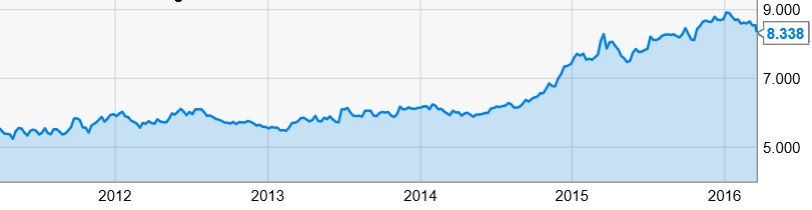
Рис. Обменный курс доллара к норвежской кроне
На начало 2012 – 5,9 и 2013 – 5,5 и 2014 – 6,1 и 2015 – 7,5 и 2016 - 8,6
Общий внешний долг Норвегии в середине 2014 года составляет примерно 703,65 млрд. долл. из которых 8,5% это государственный долг. Соотношение государственного долга к величине ВВП страны составляет 24%. Около 40% занимает долг других секторов, где важную часть занимают долги публичных и коммерческих компаний.
Таблица 3
Внешний долг Норвегии, норвежские кроны млн.
| 2011K2 | 2011K4 | 2012K2 | 2012K4 | 2013K2 | 2013K4 | 2014K2 | ||
| TOTAL | TOTAL | |||||||
| DIRECT INVESTMENTS | ||||||||
| GENERAL GOVERNMENT | TOTAL | |||||||
| THE CENTRAL BANK | TOTAL | |||||||
| BANKS | TOTAL | |||||||
| OTHER SECTORS | TOTAL | |||||||
| DIRECT INVESTMENTS | ||||||||
| Finance companies | TOTAL | 56392 | 61411 | 58739 | 59394 | 61889 | 62076 | 62671 |
| Public companies | TOTAL | 194746 | 223197 | 204939 | 215624 | 251390 | 291561 | 299764 |
| DIRECT INVESTMENTS | 203980 | 151336 | 162429 | 182567 | 152339 | 125962 | 153223 | |
| Private non-fin. сo’s and households | TOTAL | 190674 | 193483 | 197733 | 208295 | 217880 | 215043 | 229863 |
| DIRECT INVESTMENTS | 532415 | 563071 | 591465 | 608228 | 695408 | 672902 | 672503 |
Прямые инвестиции отображают межфирменное официальное кредитование и основная доля таких инвестиций приходится на нефинансовые компании и домохозяйства. В целом самыми весомыми частями долга являются долги коммерческих банков и других секторов (внебанковский).
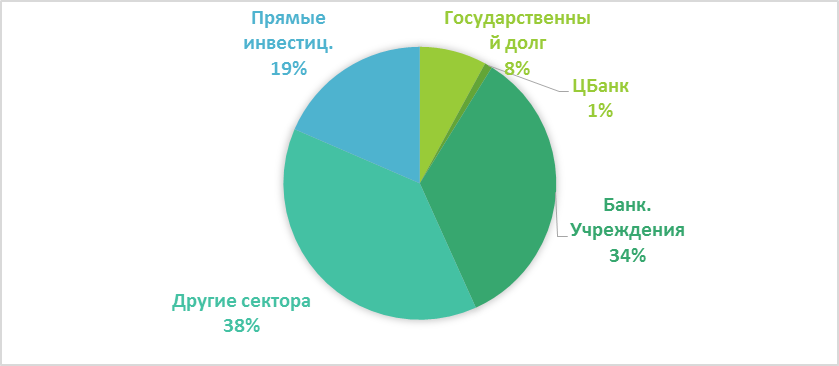
Рис. Структура Внешнего долга Норвегии по секторам (%), 2015 г. (К2)
Додаток А